

 Ben Eisdorfer
1 min read
WEBINAR: How to Automate Material Testing and Batch Process Data
If you missed our Webinar, How to Automate Material Testing and Batch Process Data, we have you covered. Just click the button below, fill out the...
14:26, Mar 30
19:00, Mar 11

The oil and gas industry is surely full of interesting engineering challenges, but maintaining and assuring the structural health of pipelines to transport precious refined or raw products is a challenge of utmost importance. Unfortunately, the environment unwaveringly ignores our best attempts at designing and installing these pipelines with the goal of maximizing their useful lifetime. As such, it’s prevalent for underground pipes to be subject to large rocks and roots pushing against their walls. These growing defects can jeopardize the structural health of a pipeline, and any failure can be catastrophic for the environment.
Various inspection techniques have been developed to identify any deformation and deviation from a pipe’s original shape. However, repairing the smallest defect can be both extremely costly as well as completely unnecessary. As such, it is critical for the owner and users of a pipeline to develop strong engineering knowledge and understanding of the right combination of shape, size, and other properties of a defect that are critical to the pipe's integrity.
One method proven over the years to address this challenge is to catalog and test a variety of actual in-situ defects while building finite-element models matching these defects. Once a strong correlation and confidence are achieved, then other defect parameters (size and shape) can be computed to build a comprehensive library of defect performances, estimating the remaining numbers of cycles it can be subjected to before failing. Measuring the deformation of these defects is extremely difficult since the uniqueness and uncontrolled shape and size of in-situ defects lead to complex hoop strains behaviors. Uniaxial and individual traditional sensors, like foil strain gauges, cannot provide the necessary data density required to reliably and quickly perform all the mechanical tests required.
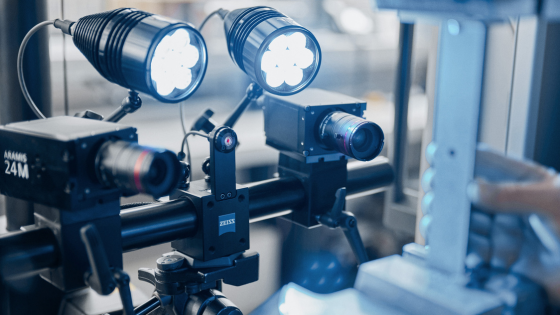
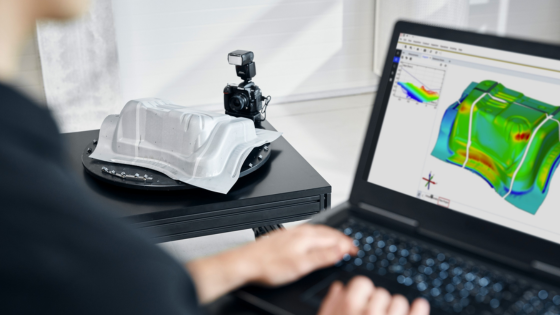
Enter Digital Image Correlation. Below is a test showing a robust methodology to cyclically pressurize a pipe section and to monitor the surface response. Using a 12 Megapixels stereo-camera system, thousands of data points can be measured across the defects during the test. In an effort to determine local deformations on the surface, this 3D ARAMIS optical strain instrument measures the displacements and strains on the whole surface of the pipe simply by tracking visible features and contrasting patterns (either natural rust or by applying light black and white paint coats to provide more contrast). In this scenario, the DIC measurement was also compared to a single strain gage on the right edge of the picture.
RAW VIDEO OF TEST
Once the images are taken, a surface component can be created to measure the strains and displacements across the area of interest. The curvature of the pipe does not allow both cameras to effectively see the corners of the picture. For any DIC measurement, both cameras must be able to see the point for it to be measured.
CREATED SURFACE COMPONENT
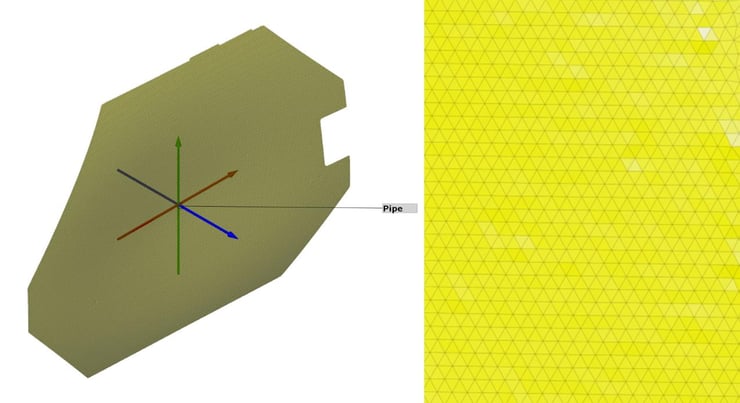
The two cameras of the stereo-system break the image of the defect into thousands of smaller unique zones (like a puzzle) and triangulate how each piece moves throughout the test recording, using our Digital Image Correlation 3D algorithm. A coordinate system can easily be defined along the pipe longitudinal axis. Here is a snapshot of the resulting coordinate system and mesh built from one such test.
COORDINATE SYSTEM AND MESH
Once the entire defect area of the test article is reconstructed virtually, various inspections can be created to analyze the hoop strain behavior. Below are videos of the major and minor strain inspections of the created surface component.
VIDEO OF MAJOR STRAIN
VIDEO OF MINOR STRAIN
Using a Rigid Body Motion Compensation (RBMC), local defects on the surface can be identified. An RBMC allows us to analyze the deformation of the surface relative to itself to see local buckling and warpage. The surface's average displacement is subtracted from each point to show these effects.
INSPECTING LOCAL DISPLACEMENT DEFECTS WITH AN RBMC
This application also shows the value of a full field ARAMIS system compared to a single point strain gage. In fact, the strain variability across the surface component is much more valuable than a single data point, and clearly, a single point value from a gage is insufficient to understand and quantify the true behavior of the test article. Using directional strains (EpsX and EpsY), the ARAMIS strain values can still be directly compared to a rosette foil strain gage if desired.
EPSX STRAIN GAGE COMPARISON
EPSY STRAIN GAGE COMPARISON
Analyzing these hoop strains will be critical to monitoring the structural health of the pipe and determining the impact of any defects. This type of analysis would be impossible with only single-point strain gages. The complexity of strains and local deformations can only be seen across a surface with DIC using the 3D ARAMIS optical strain instrument.
Using ARAMIS optical strain to measure pipeline defects can save the oil and gas industry a lot of time and money and prevent any catastrophic failure of pipelines. Read more about how ARAMIS can replace strain gages and displacement sensors!

1 min read
If you missed our Webinar, How to Automate Material Testing and Batch Process Data, we have you covered. Just click the button below, fill out the...

1 min read
{% video_player "embed_player" overrideable=False, type='hsvideo2', hide_playlist=True, viral_sharing=False, embed_button=False, autoplay=True,...
1 min read